Example Usage
This example demonstrates an end-to-end use case of phylogenetic tracking to a population of custom Organism objects propagated through asexual reproduction.
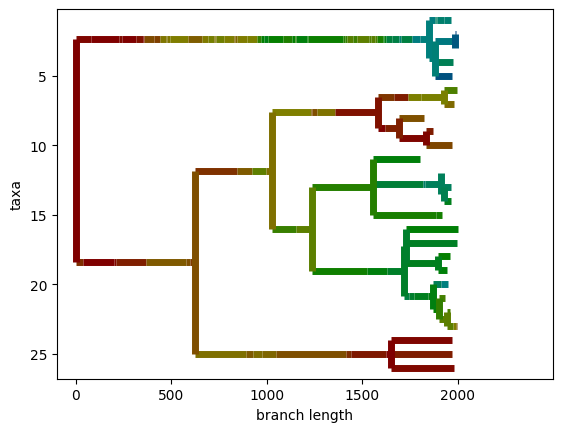
In this demo, organisms contain HSV-encoded color data and are selected for contrast with other population members. Organisms with the same hue are considered as members of the same taxon. The population is progressed through 1,000 rounds of tournament selection, then the systematics manager is serialized to create an alife-standard data file. After loading serialized data back into the notebook and converting to Biopython, we can visualize hue values over evolutionary history of the population.
Setup
Begin by importing necessary packages.
[1]:
import colorsys
from copy import copy
from dataclasses import dataclass

import alifedata_phyloinformatics_convert as apc
from Bio import Phylo as BioPhylo
from colormath import color_conversions, color_diff, color_objects
from matplotlib import pyplot as plt
import numpy as np
import pandas as pd
from tqdm import tqdm

from phylotrackpy import systematics
Reproducibility.
[2]:
np.random.seed(1)

%load_ext watermark
%watermark -iwbmuvg -iv
Last updated: 2024-11-14T07:54:03.208075+00:00

Python implementation: CPython
Python version       : 3.9.19
IPython version      : 8.18.1

Compiler    : GCC 11.4.0
OS          : Linux
Release     : 5.19.0-1028-aws
Machine     : x86_64
Processor   : x86_64
CPU cores   : 2
Architecture: 64bit

Git hash: f37c2a0bf297ac31f3c6c6d085224a8b9002429f

Git branch: HEAD

numpy                             : 1.23.5
colormath                         : 3.0.0
alifedata_phyloinformatics_convert: 0.16.2
matplotlib                        : 3.8.3
phylotrackpy                      : 0.2.4
Bio                               : 1.6.2
pandas                            : 1.5.2

Watermark: 2.4.3
Patch numpy for compatibility with colormath package.
[3]:
# https://github.com/gtaylor/python-colormath/issues/104
import numpy


def patch_asscalar(a):
    return a.item()


setattr(numpy, "asscalar", patch_asscalar)
Write organism class.
[4]:
@dataclass
class Organism:
    hue: float = 0.0
    saturation: float = 0.0
    value: float = 0.0

    def mutate(self: "Organism") -> None:
        """Probabilistically tweak stored color information."""
        if np.random.rand() < 0.5:
            self.hue = np.clip(self.hue + np.random.normal(0, 0.05), 0, 1)
        if np.random.rand() < 0.5:
            self.saturation = np.clip(
                self.saturation + np.random.normal(0, 0.02), 0, 1
            )
        if np.random.rand() < 0.5:
            self.value = np.clip(self.value + np.random.normal(0, 0.02), 0, 1)

    def make_offspring(self: "Organism") -> "Organism":
        """Return copy of self with mutation applied."""
        offspring = copy(self)
        offspring.mutate()
        return offspring

    def to_labcolor(self: "Organism") -> color_objects.LabColor:
        """Create colormath `LabColor` object representing stored color data."""
        as_hsv = color_objects.HSVColor(self.hue, self.saturation, self.value)
        return color_conversions.convert_color(as_hsv, color_objects.LabColor)

    def calc_distance(self: "Organism", other: "Organism") -> float:
        """Calculate color-theoretic distance between own color and other
        `Organism`'s color."""
        return color_diff.delta_e_cie1976(
            self.to_labcolor(), other.to_labcolor()
        )
Calculate fitness values for population members, favoring Organisms that contrast other population members.
[5]:
def calc_fitnesses(organisms: list[Organism]) -> list[float]:
    return [
        np.max(
            [
                Organism.calc_distance(organism, other)
                for other in np.random.choice(organisms, 10)
            ],
        )
        for organism in organisms
    ]
Set up population tracking infrastructure. Use dummy founder to force common ancestry among all population members.
Write reproduce and remove helpers to wrap systematics bookkeeping tasks.
[6]:
population = [Organism() for _ in range(50)]

syst = systematics.Systematics(lambda org: str(org.hue))
founder_taxon = syst.add_org(Organism())
taxa = {id(org): syst.add_org(org, founder_taxon) for org in population}
syst.remove_org(founder_taxon)


def reproduce(parent: Organism) -> Organism:
    offspring = parent.make_offspring()
    parent_taxon = taxa[id(parent)]
    taxa[id(offspring)] = syst.add_org(offspring, parent_taxon)
    return offspring


def remove(org: Organism) -> None:
    taxon = taxa[id(org)]
    syst.remove_org(taxon)
    del taxa[id(org)]
Run rolling evolutionary loop, one tournament at a time.
[7]:
TOURNAMENT_SIZE = 7
NUM_UPDATES = 2000
for update in tqdm(range(NUM_UPDATES)):
    syst.set_update(update)  # track time in systematics manager

    # do one tournament
    fitnesses = calc_fitnesses(population)
    target_idx = np.random.randint(len(population))
    selection = max(
        np.random.randint(len(population), size=TOURNAMENT_SIZE),
        key=fitnesses.__getitem__,
    )

    # create offspring and replace target index
    offspring = reproduce(population[selection])
    remove(population[target_idx])
    population[target_idx] = offspring
100%|██████████| 2000/2000 [02:16<00:00, 14.63it/s]
Export and Visualize
Output phylogenetic history, including column storing taxon info (hue values).
[8]:
syst.add_snapshot_fun(systematics.Taxon.get_info, "taxinfo")
syst.snapshot("/tmp/phylo.csv")
Load from file and convert to BioPython.
[9]:
bp_tree = apc.alife_dataframe_to_biopython_tree(
    pd.read_csv("/tmp/phylo.csv"),
    setattrs=["taxinfo"],
    setup_branch_lengths=True,
)
Set branch colors and draw.
[10]:
for node in bp_tree.find_elements():
    if hasattr(node, "taxinfo"):
        rgb_float = colorsys.hsv_to_rgb(node.taxinfo, 1.0, 0.5)
        rgb_int = tuple(int(c * 255) for c in rgb_float)
        node.color = rgb_int

with plt.rc_context({"lines.linewidth": 5}):
    BioPhylo.draw(bp_tree)